Benchmarks
Parse.ly’s benchmarks page — available for authors, sections, and tags — allows comparison between these. With benchmarks, you can also analyze month-over-month or quarter-over-quarter metrics. Finally, use benchmarks to see how posts perform for a particular author, section, or tag.

Where to find benchmarks
From the Authors, Sections, or Tags tab of the Parse.ly Dashboard, click an individual author, section, or tag to visit that details page. From an author, section, or tag’s details page, click the “View Benchmarks” button at the top right.

Filtering the benchmarks page
You can easily visit a different author, section, or tag’s benchmarks page using the drop-down menus. Toggle between “Month” and “Quarter,” then choose a specific time period (e.g., July 2025, 2025 Q3).
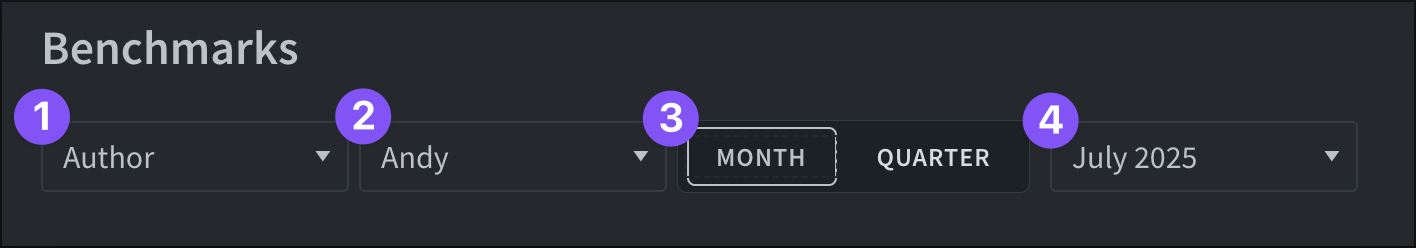
- Choose from “Author,” “Section,” or “Tag.”
- Select the author, section, or tag from those available to view that benchmarks page.
- Choose to focus on a month or quarter.
- Select the specific month or quarter.
An author, section, or tag’s benchmarks page can be further filtered similarly to the rest of the Dashboard. Filters set here apply to the entire benchmarks page, including the histograms at the top and the bubble chart under Posts Performance.

Note
If an author filter is applied on author’s benchmarks page (or a tag filter on a tag’s page or section filter on a section’s page), this likely won’t change the bubble chart under the Posts Performance section. This is because the bubble chart there shows only posts for that author (or section or tag).
Example: The section filters of “Science” and “Economy” are applied to a Science section’s benchmarks page. Those two sections appear in the histograms, but the bubble chart continues to show posts from only the Science section.
Last updated: July 17, 2025